- 4 Posts
- 249 Comments

 0·4 days ago
you often need to buy it from other countries. For instance, Russia. Not great.
Yeeeeah, I wouldn’t worry about that. Sure we (Australia) are conservative with our fears of mining and exporting uranium, especially with the Cold War and reactor whoopsies around the world. But historically it doesn’t take much for us to go down on an ally.
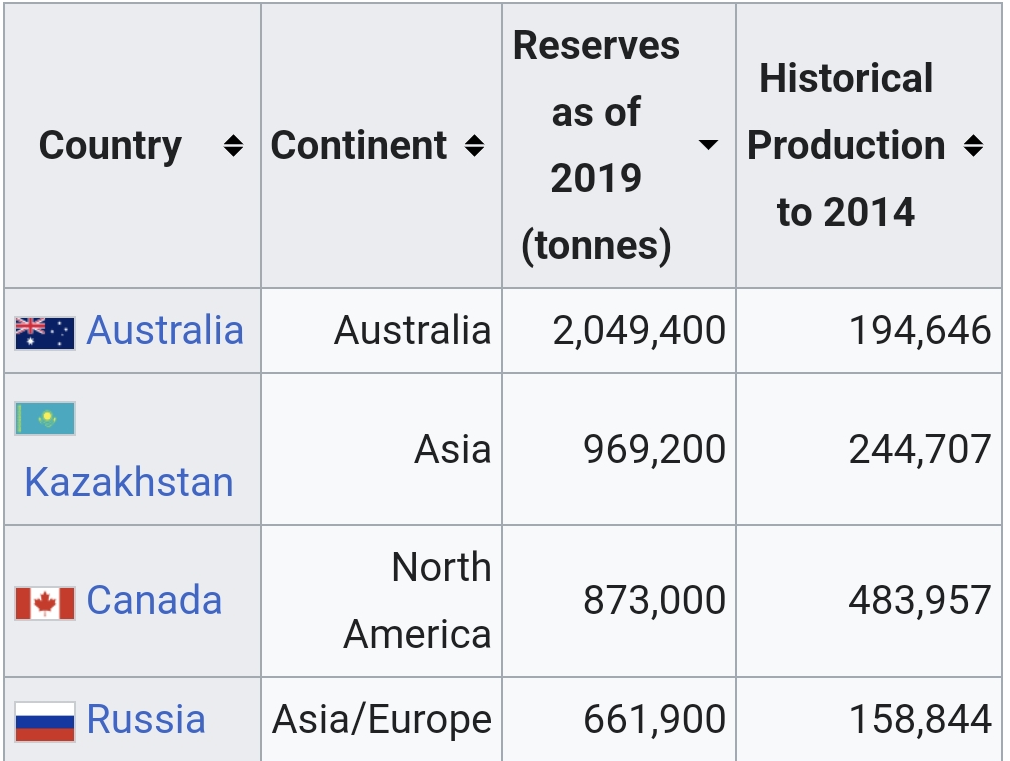
Just let us finish unloading all our coal off to the worst polluting nations first, then we’ll crack the top-shelf stuff.
 1·5 days ago
deleted by creator
 41·7 days ago
Unfortunately it depends on who’s doing it. Who’s creatively in charge and what freedom they get.
At the moment, it’s reliably bad. Even when the vision is good, it’s dominated by invested poo poo.
It’s hard to tell if it was/is logistically effective vs. everyone shitting in it because that’s trendy rn.
With knowing absolutely nothing, I can only assume it’s an excellent concept that will (unfortunately) help a lot in a broad range of situations.
At the moment, plenty of creases to iron out, but it’s not a failure and humanitarian aid can definitely bolster with it.
I really loved your comment. I tried to reply to you, but obv couldn’t. Then tried to PM you, but couldn’t figure it out or I just can’t.
It was really insightful for both perspective on myself and on the community.
Go on…
Just curious if you can.
Oh, I’ve never looked into it, I just noticed it sometimes. I don’t say anything harmful or nasty, just unpopular so I expect downvote burial even before I hit the post button haha. I figure that’s how it’s always meant to work. Downvotes handle dipshit remarks, mods handle malicious ones. But seems entire conversations with multiple people get removed because, despite all the positive upvotes and people involved in a good ol’ fashion discussion, a mod has a different personal opinion and it all goes. Even the off-hand comments connected to that thread.
Gee. Would hate to be the crew meant to be returning on that thing. Was a bit of a shitshow getting up there.
It sounds like you just did, but you’re playing it off.
Do it. The attractiveness of EU cars in China has a lot to do with expression of wealth, status, and exclusivity. It’s free marketing.
Make a cheaper model aimed at the market to offset the tarrif and the logo on front will sell itself.
You gotta remember World Wars take a bit to warm up first. Skirmish here, escalation there, lots of sitting on thumbs for a while, and then everyone piles in after the rate of occupation starts to get out of hand and the aggressors show deft multi-tasking skills.
2027
The dilution of “anger from China”.
It’s as long a running joke as https://en.wikipedia.org/wiki/China’s_final_warning
Seriously, they could be genuine some day. Like warn the world against some major catastrophe, but we’ll assume that if China’s upset, it’s nothing to worry about or may even be something we want to happen.
 5·13 days ago
Never heard of 'em. Good thing we don’t have things in place where some random country can block the rest of them.
That’s a tough question in analytics lol
You mean mathematical examples? Or like examples of analytical outcomes? Keeping in mind the more analytics-heavy, the more it involves lots of sources, patterns, variables, and scenarios, but I could provide just a single example.
Edit: Oh, wait. If you’re referring to just averages… In forecasting I prefer, as a minimum, to do weighted averaging. This is where I’ll have a certain time period of cumulated historical data that provides a more stable base, however more weight is applied the more recent (relevant) the data is. This shows a more realistic average than a single snapshot of data that could be an outlier.
But speaking of outliers, I’d prefer to also apply weight to outlying data points that may skew the output, especially if sample size is low. Like 1, 2, 2, 76, 3, 2. That 76 obviously skews the “average”.
Above that, depending on what’s required, I’ll use a proper method. Like if someone wants to know on average how many trucks they need a day, I’ll utilise Poisson instead to get the number of trucks they need each day to meet service requirements, including acceptable queuing, during the day. Like how the popular Erlang formulas utilise Poisson distribution and can kind of handle 90% of BAU S&D loading in day to day operations with a couple clicks.
That’s a basic example, but as data cleanliness increases, those better steps can be taken. Could be like 25 average last Wed vs. 20 weighted average over last month vs. 16 actually needed if optimised correctly.
Oh, and if there’s data on each truck’s mileage, capacity, availability, traffic density in areas over the day, etc…obbioisly it can be even more optimised. Though I’d only go that far if things were consistent/routine. Script it, automate it, set and forget and have the day’s forecast appear in the warehouse each morning.
And yet such simple things are often incredibly hard to get done because of poor data governance or systems.
Yeah, but American “liberals” aren’t actually liberals in any way. They’re just conservative narcissists inappropriately using that label to get away with very non-liberalism shit that ironically oppresses people’s freedoms for the sake getting/maintaining what they want.
It’s true. I didn’t realise how much a piece of shit I was until- Waaaait a minute…
Did you just assume binary genders?
pulls out taller soapbox
How dare you!

Yeah, but it is on the internet.